|
To understand the dynamics of diabetes is first necessary to understand how diabetes is handled in the non diabetic subject:
Simplifying we can divide the processes of glucose handling in 2 main situations:
1- postprandial (6 hours after a meal)
2- fasting (8 and more hs after a meal)
let us start with the post prandial processes: in this period the glucose coming from the food enters the body from the stomach, and simultaneously the intestine gives some nervous and andocrine signals to the pancreas to secrete insulin.
The insulin allows the entrance of glucose into cells. In this section we will discuss mostly of two organs, the muscle and the liver ( see the figure, and the slides that can be downloaded and read on XP power point)
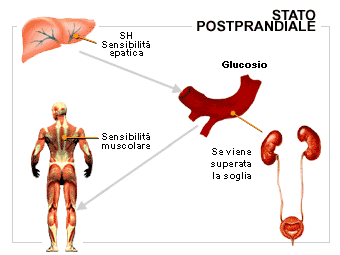
In the slide the photos of the bayside symbolize the modulation of the insulin effect due to the insulin resistance. The slide shows a characteristic of diabetes: when the insulin is not enough and the insulin sensitivity is reduced (that is to say insulin resistance is high) the glucose in the blood increases over a value defined “threshold” and spills into the urine carrying with itself water. This is the basis for the characteristic increased diuresis of the diabetes.
Another important point is that the muscle has a great surface in the body: the wider this surface is the more sugar it takes, and this mechanism helps normalize tha blood glucose level. Furthermore if this surface is activated by the physical exercise the use of glucose increases further. This is the reason why a regular physical training increasing muscle size may lower the blood glucose level in the diabetic or prevent diabetes in those who are predisposed.
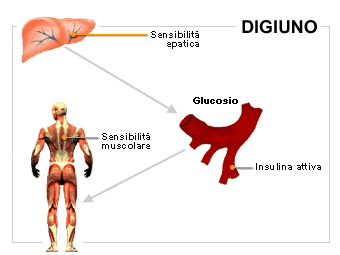
In the fasting state the dynamic of blood glucose regulation is different: there is no inflow of muscle from the gut, and thus, contrary to the events during the post prandial period no signal from the gut stimulates the pancreas to secrete insulin. Thus the inflow of glucose into muscle is reduced and the liver even reverses the flux liberating glucose into the blood. This is schematically represented in the following figure
|